
A popular argument by pro-Romney polling analysts right now goes like this:
- Mitt Romney is winning big with Independents.
- The polls are oversampling the percentage of voters who identify as Democrats versus the 2008 exit poll.
- Democratic turnout will be lower in 2012 because 2008 was a wave election.
- Therefore if you adjust (or "unskew") Democratic turnout lower, but maintain Romney's big lead with Independents, then Romney can't possibly lose.
This argument has been made most frequently about Ohio -- the state analysts on both sides of aisle agree is the key to the election. The Romney campaign made that argument here saying that it's "just not possible" that the recent Ohio Time Magazine poll shows Romney losing by five points statewide but winning Independents by 15. The conservative polling analyst @numbersmuncher has made this argument repeatedly in his tweets and argued a similar point to the Romney campaign in this blog post about Ohio.
Upon first glance, this argument sounds very reasonable. It led Mark Halperin to tweet Wednesday morning "And/but at some point someone is going to have to explain how Obama could have leads in so many polls where he is losing independents." Other reporters have posed similar questions.
The main reason this is happening is relatively simple -- it's because most polls in Ohio show the Democrats with a party identification advantage that is large enough to more than make up for Romney's advantage with Independents. Republicans say that's bogus, but there are two big problems with their argument:
Equating "Democratic turnout" with "Democratic party identification advantage" is wrong.
As has been written about ad nauseum in this election cycle, party identification is an attitude and can change. Just because a poll shows that Democrats has a greater party identification advantage in 2012 than in 2008 does not mean that poll is saying Democratic turnout will be higher this year. All it means is that more people are identifying as Democrats than Republicans. It could be as much about fewer voters identifying as Republicans than it is about more voters identifying as Democrats. (A couple of thoughtful posts on the topic of a weakening GOP party brand are here from Josh Marshall of Talking Points Memo and here from the Politics by Numbers blog).
To really measure Democratic turnout, it would be better to look at metrics that are fixed including regional metrics (like county, density or precinct), demographic metrics that correlate strongly to voter preference (like age and ethnicity), or fixed partisan metrics (like party registration or primary participation).
The second problem with this argument is that in recent Ohio polling, Romney's lead with Independents is inversely correlated with Democratic party identification advantage.
What does this mean? It means that polls with larger Democratic party identification advantages are showing bigger leads for Romney with Independents. And vice versa.
The following chart is a slight adjustment of a chart posted by @numbersmuncher last week showing party identification spreads vs. the vote among Independents in recent Ohio polls where this data is published. The chart below is sorted by Democratic party identification advantage -- so the polls with the greatest Democratic margins are up top and the polls with the lowest margins are at the bottom:
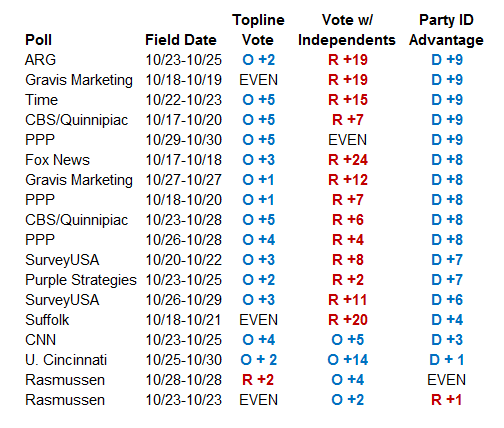
A quick glance at the chart above clearly shows this inverse correlation. Romney's biggest leads with Independents (except the one Suffolk poll) all come in polls where the Democratic party identification is largest. And the math backs up what the eye sees -- the correlation coefficient between the Independent vote and the party identification advantage is -0.61. While the correlation is by no means perfect (there are many other variables that impact these numbers), the trend clearly exists.
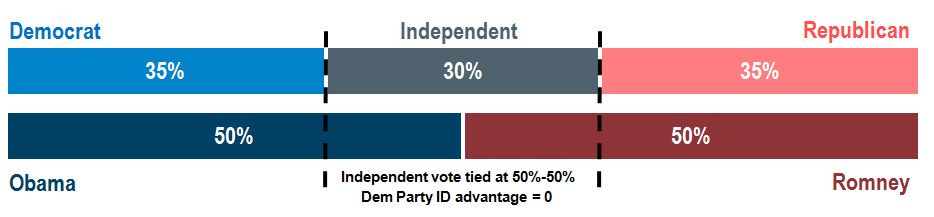
Why does this trend exist? Here's a hypothetical to help explain it. Imagine two surveys: both showing an even 50 percent - 50 percent race (removing undecideds for simplicity's sake). In both surveys, let's also assume that all the Democrats vote for Obama and all the Republicans vote for Romney.
The chart below shows the first hypothetical survey. Here, there is no identification advantage for either party and Independents are split down the middle. That scenario might look something like this: 35 percent Democrat and 35 percent Republican with the 30 percent of Independents splitting their vote at 50 percent for each candidate:
In the second hypothetical survey, we have shifted 5 percent of the Obama-voting Independents to be Democrats and 5 percent of the Romney voting Republicans to be Independents. This gives the same topline result (50 percent for Obama and 50 percent for Romney), but also a 10-point party identification advantage for Democrats and a huge Romney lead among Independents (67 percent to 33 percent):
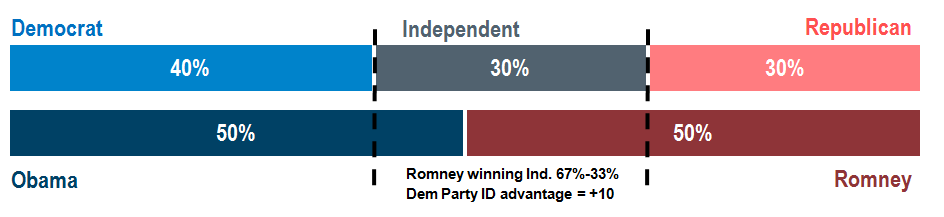
In the real world, things are a lot messier than this, but these examples help explain the trend. Romney wins big among Independents when the underlying profile of the Independent vote shifts to be more conservative. However, that is often accompanied by an increase in the Democratic party identification advantage.
The final question you might ask is: How can two polls show the same top-line result (50 percent - 50 percent) with such different party identification advantages? This can happen for a number of reasons. Pollsters use different questions and methodologies. Live interview polls and automated polls produce different party identification distributions (ones that are also different from in-person Election Day exit polls). Pollsters ask party identification in different ways. Some use three-point scales, others five-point scales and others seven-point scales. Some push "leaners" and some don't. Question ordering also matters - especially for pollsters who put party identification at the end of their survey. If you have a survey with a bunch of questions on social issues, it might cause more people to identify as Democrats in a socially liberal state, but might cause more people to identify as Republicans in a more socially conservative state.
The point is that there are a myriad of factors that might impact party identification from poll to poll. Trying to "fix" each poll by sticking to a rigid analysis of the Independent vote and party identification versus the 2008 exit polling can lead to the wrong conclusions. The most important thing is to look at what these polls are collectively saying about the race in Ohio -- that the president has a small but consistent edge in the state across nearly every poll that has been conducted.