
Several years ago the idea that fiscal austerity could induce growth, "expansionary austerity", had a brief flowering before withering under the heat of ridicule. Recently it resurfaced under a different name, "deflationary boom". If expansionary austerity was oxymoronic, deflationary boom is simply moronic.
To deconstruct and disinfect deflationary boom we need an operational definition of deflation. Defining deflation as a fall in an aggregate price index (i.e. a negative rate of change of the price level) is correct but not operational. The definition becomes operational once we specify the appropriate measure; e.g. consumer index, producer index, GDP deflator, etc. The commodities differ across the various measures, appearing in some but not others, and with differing weights.
Once one specifies the appropriate measure, the task becomes clarifying how to interpret it. Market economies are dynamic systems with new products continually added and the quality of existing products increasing. As a result, if the measure of the price level remains constant, prices have fallen. A generally accepted guideline is that a measured rate of inflation of 1½% implies a constant price level.
With the meaning and measure of inflation and deflation clarified, it becomes possible to analyse what has happened in the euro zone over the last several years. The chart below reports the rate of change of consumer prices for non-euro UK (dashed blue line), USA (red line), Germany (black line), France (solid blue) and the other 17 countries of the euro zone (shaded columns).
The Great Recession of 2008 provoked a sharp fall in the rate of change of consumer prices for all countries, falling to negative rates in 2009. A rise in prices followed, which ended in mid-2011, coinciding with the enforcement of austerity programmes in several countries of the euro zone (Greece, Ireland, Italy, Portugal and Spain).
The legend in the chart reports the rate of price change from mid-2011 through the third quarter of 2015. From the beginning of 2013 price changes for France, Germany and the Euro17 all were below the 2% inflation target of the European Central Bank (dashed horizontal blue line). This in itself should qualify as "deflation", performance below the policy level set by the ECB, which, however dubious, purports to be the appropriate minimum rate for a healthy economy.
Over that same period price changes in France and the Euro17 were not only below the policy target, they also fell below the accepted measure of negative price changes (dashed red line). In late 2013 Germany joined them. By any reasonable measure, the euro zone has experienced continuous deflation for at least two years, and arguably for four years.
The optimistic assertion that the euro zone clawed out of deflation in the third quarter of this year represents a lack of understanding of inflation measures and market economies.
Inflation to Deflation in the Euro Zone, 2008-2015
(consumer price index, quarter on quarter annual rates)
Source: OECD. Euro17 is all euro countries less France & Germany. Rate of price change in legend measured from 2011Q2.
During the transition to deflation economic growth in Europe has gone from slow to stagnation and decline, as the second chart shows. As for inflation rates, GDP growth declined sharply during the Great Recession, then began a rapid recovery until several euro zone governments implemented anti-growth austerity programmes in 2011.
Growth to Stagnation in the euro zone, 2008-2015
(quarter on quarter annual rates)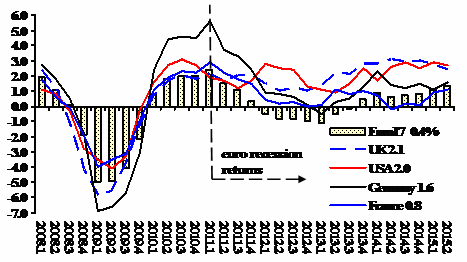
Source: OECD. Euro17 is all euro countries less France & Germany. Growth rates in legend measured from 2011Q1.
Since the beginning of 2012 neither France nor the Euro17 achieved an annualized rate of growth as high as 2%, and Germany did so only once (in the first quarter of 2014).
As explained above, we should interpret inflation less than 1.5% as deflation. We can establish an analogous guideline for GDP growth. Over the long run growth of the labour force and productivity determine the sustainable growth rate of a market economy, and investment to a substantial degree determines productivity change.
A study conducted for the European Commission concluded that productivity growth of 1.5-2.0% could be expected for the foreseeable future. Combined with a quite low anticipated population increase, a sustainable rate in the range of 2.0-2.5% would represent at realistic estimate.
Therefore, any growth rate below 2% represents under-performance compared to potential. By this guideline, the euro zone growth rates since 2011, rarely above 1.5%, qualify as stagnation.
The algebra works out quite simply:
Inflation less than 2% → growth less than 2% = STAGNATION
To put it in a phrase, "deflationary bust".