
Written with Sharad Goel and Houshmand Shirani-Mehr
Election forecasts, whether on HuffingtonPost's Pollster, New York Times’ Upshot, FiveThirtyEight, or PredictWise, report a margin of error of typically 3 percentage points. That means that 95 percent of the time the election outcome should lie within that interval. We find, however, that the true error is actually much larger than that, and moreover, polls historically understate support for Democratic candidates.
To estimate the true margin of error, we looked at all polls for senatorial races in 2012 that were published on the two major poll aggregation sites (Huffington Post’s Pollster and Real Clear Politics).Then, using the standard formula, we computed their theoretical margin of error. Finally, we simply plotted the percentage of polls where the outcome of the election actually fell within the standard confidence range.
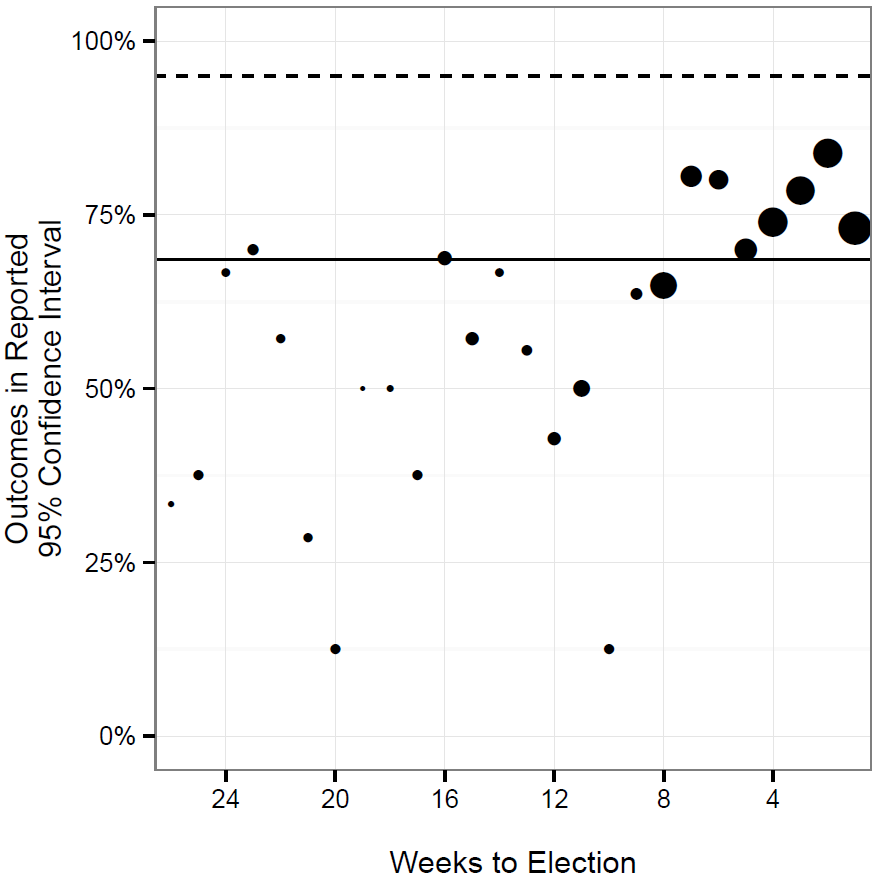
Note: Data are from Huffington Post’s Pollster and Real Clear Politics. The thick horizontal line, a little below 70 percent, represents overall percent of outcomes in the reported 95 percent confidence ranges.
For polls conducted right before Election Day, the actual election outcome falls within a poll’s stated 95 percent confidence interval about 75 percent of the time. That means that whereas the polls’ margin of error says they should capture 95 percent of outcomes, they in fact capture only 75 percent. In other words, the reported margins of error are far too optimistic.
Why are the reported confidence intervals too narrow? First, polls only measure attitudes at the time they were conducted, not on Election Day, and the standard error estimates neglect to account for this. (To be fair, the pollsters typically add the disclaimer that results reflect the likely outcome of a hypothetical election held on the day of the poll.) But, close to Election Day, there is probably little real change in support, and the reported confidence intervals are still too small. This discrepancy is attributable to polling companies reporting only one of four major sources of error, as we describe below.
Sampling Error: This is the one source of error that pollsters do report, and it captures the error associated with only measuring opinions in a random sample of the population, as opposed to among all voters.
Coverage Error: Pollsters aim to contact each likely voter with equal probability and deviations from this result in coverage error. This was relatively easy in the world of ubiquitous landline phones (remember those?), but with the rise of cell phones and internet it is not so easy to determine how to mix polling methods so that any given likely voter is contacted. This problem is getting worse each year, as landline penetration decreases. Coverage error is exacerbated by shifting modes of voting, such as voting by mail or early voting, which complicate traditional screens used to determine who is likely to vote.
Non-Response Error: After identifying a random set of likely voters, pollsters still need them to actual answer the polling questions. If those who are willing to be interviewed systematically differ from those who are not, this introduces yet another source of error, non-response error. This problem is also getting worse each year, as people are increasingly reluctant to answer cell-phone calls from unknown numbers or to take ten minutes to answer a poll in a busy world.
Survey Error: The exact wording of the questions, the order of the questions, the tone of the interviewer, and numerous other survey design factors all affect the result, leading to still another error source.
As Nate Cohn outlined in the New York Times on Thursday, the latter three error sources are more likely to undercount Democrats than Republicans. For example, Democrats are more likely than Republicans to have a cell-phone from a different area code than where they currently live (like all three of the authors of this article), which in turn results in coverage error since such individuals cannot be included in state-level polls. Cohn notes that among cell-phone only adults, people whose area code does not match where they live lean Democratic by 14 points, whereas those that matched lean Democratic by 8 points. For an example of non-response and survey error, Cohn notes that Hispanics who are uncomfortable taking a poll in English are more likely to vote Democratic than demographically similar Hispanics.
Thus, we expect the actual polling errors to be larger than the stated errors, and moreover, we expect polling results to favor the Republicans. This pattern is strikingly apparent when we plot the observed differences between poll predictions and actual election outcomes for the 2012 Senate races. Positive numbers indicate the poll skewed in favor of the Republicans. Alongside the observed differences, we plot the theoretical distribution of poll results if sampling error were the only factor.
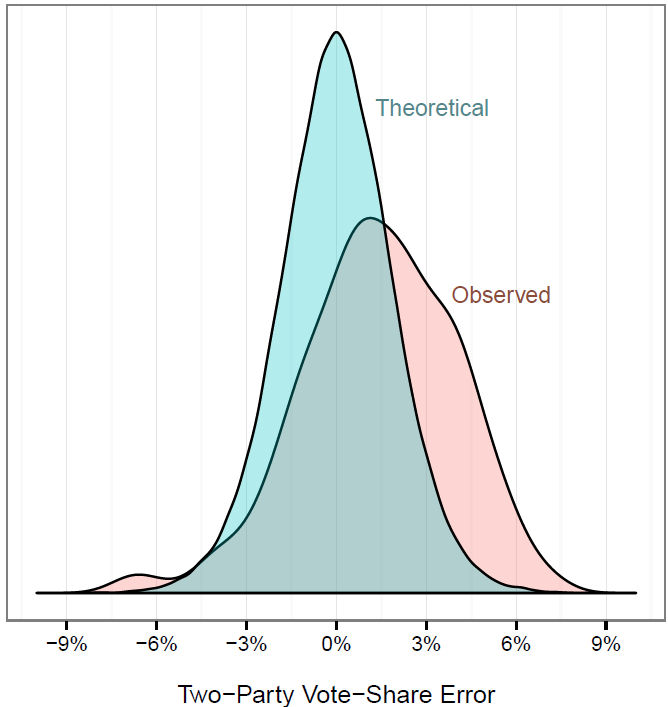
Note: Data are from Huffington Post’s Pollster and Real Clear Politics.
The observed distribution clearly skews toward the Republican candidates. Further, the observed distribution is wider than the theoretical one, in large part because the polls are conducted over several weeks prior to the election, while the theoretical distribution does not take into account how much candidate support varies over the course of the campaign.
How much do these overly optimistic forecasts matter? First, the theoretical 3 percentage point margin of error is already substantial, and puts nearly every competitive race within that range. Second, when you add in the unaccounted for errors, election outcomes in contested races are simply far less certain; and coverage and non-response errors will likely only get worse each cycle. Third, while aggregating a bunch of polls for each election reduces the variance, it does not eliminate the bias, so these overconfident predictions pose a problem for aggregate forecasts as well. In short, those fancy models that show probability of victory are only as good as their ingredients, and if the polls are wrong, the poll aggregations will be wrong as well.
Sharad Goel is an Assistant Professor at Stanford University
David Rothschild is an economist at Microsoft Research and runs PredictWise
Houshmand Shirani-Mehr is a graduate student at Stanford University